IPython notebook and Spark setup for Windows 10

I recently took a new job as a Senior Data Scientist at a Consulting firm, Clarity Solution Group, and as part of the switch into consulting I had to switch to a Windows (10) environment. I have been a loyal Mac and Linux user up until now, so it was a bit of a jump setting up all the tools the way I like. Since I will be using Python, IPython notebooks, and Spark for the majority of the work that I do I wanted to be able to initiate it with a single keyword from the command line. As a pre-requisite you may need to download an unzip tool like 7z

Install Java jdk

You can download and install from Oracle here. Once installed I created a new folder called Java in program files moved the JDK folder into it.  Copy the path and set JAVA_HOME within your system environment variables.  The add %JAVA_HOME%\bin to Path variable. To get the click start, then settings, and then search environment variables. This should bring up ‘Edit your system environment variables’, which should look like this:

Screenshot (2)

Installing and setting up Python and IPython

For simplicity I downloaded and installed Anaconda with the python 2.7 version from Continuum Analytics (free) using the built-in install wizard. Once installed you need to do the same thing you did with Java.  Name the variable as PYTHONPATH, where my paths were C:\User\cconnell\Anaconda2. You will also need to add %PYTHONPATH% to the Path variable

Installing Spark

I am using 1.6.0 (I like to go back at least one version) from Apache Spark here. Once unzipped do the same thing as before setting Spark_Home variable to where your spark folder is and then add %Spark_Home%\bin to the path variable.

Installing Hadoop binaries

Download and unzip the Hadoop common binaries and set a HADOOP_HOME variable to that location.

Getting everything to work together

  1. Go into your spark/conf folder and rename log4j.properties.template to log4j.properties
  2. Open log4j.properties in a text editor and change log4j.rootCategory to WARN from INFO
  3. Add two new environment variables like before: PYSPARK_DRIVER_PYTHON to jupyter (edited from ‘ipython’ in the pic) and PYSPARK_DRIVER_PYTHON_OPTS to notebook

Screenshot (1)

Now to launch your PySpark notebook just type pyspark from the console and it will automatically launch in your browser.


Art, Arduino, Sound Sensors, LEDs, and Star Wars!

Regular drawing and painting just didn’t seem to fit the bill of a creative outlet for me, so I decided to design my own mix of art, Arduino, LEDs, sound sensors and star wars all sprinkled with a little computer code.  The end product is a MASSIVE (4’x5′) Star Wars art piece with lights that wirelessly dance to the beat of the music.  I hope this inspires you to build your own.

The list of supplies:

For the tech side:

IMG_0171

I got all the tech working by compiling an uploading the following code to the Arduino:


#define REDPIN 5
#define GREENPIN 6
#define BLUEPIN 3

int redNow;
int blueNow;
int greenNow;
int redNew;
int blueNew;
int greenNew;

void setup()
{
pinMode(7,INPUT); //SIG of the Parallax Sound Impact Sensor connected to Digital Pin 7
pinMode(REDPIN, OUTPUT);
pinMode(GREENPIN, OUTPUT);
pinMode(BLUEPIN, OUTPUT);
redNow = random(255);
blueNow = random(255);
greenNow = random(255);
redNew = redNow;
blueNew = blueNow;
greenNew = greenNow;

}

#define fade(x,y) if (x>y) x–; else if (x<y) x++;

void loop()
{
boolean soundstate = digitalRead(7);
if (soundstate == 1) {
analogWrite(BLUEPIN, blueNow);
analogWrite(REDPIN, redNow);
analogWrite(GREENPIN, greenNow);
redNew = random(255);
blueNew = random(255);
greenNew = random(255);
// fade to new colors
while ((redNow != redNew) ||
(blueNow != blueNew) ||
(greenNow != greenNew))
{
fade(redNow,redNew)
fade(blueNow,blueNew)
fade(greenNow,greenNew)
analogWrite(BLUEPIN, blueNow);
analogWrite(REDPIN, redNow);
analogWrite(GREENPIN, greenNow);
delay(1);
}
}
else{
digitalWrite(REDPIN,0);
digitalWrite(GREENPIN,0);
digitalWrite(BLUEPIN,0);
}
}

Then I put all the wiring together using this schematic.

Darth

I started by tracing out Darth Vadar using a projector onto the floor under layment board.

IMG_0138

Cut out everything that was white.

IMG_0143 IMG_0142

Glue and fixed everything I broke.

IMG_0145 IMG_0146 IMG_0147

and because I’m a bit of a perfectionist, weeks and weeks of sanding, filling, sanding, cutting (again), more sanding, and fine tooth filing with a jewelers file

IMG_0177 IMG_0169 IMG_0168 IMG_0170IMG_0207 IMG_0210

Then more cutting… this time it’s the backing plate (the MDF sheet):

IMG_0203

This holds the LEDs, hides the wires, and provides structural support for the artistic front which we glue to next.

IMG_0214

Now paint the back side with the chrome paint to reflect light.

IMG_0218

LEDs were double sided taped around the outside of where I cut it out (see pic above). Paint the front with the flat black paint (I seem to have forgotten to take a pic.)  The wiring comes next following this schematic and the Arduino, sound sensor, and one of the bread boards glued to the front.  You can see I hid the wires by using a small router on the backing plate .

IMG_5935IMG_0219

Then all that left is attaching the picture hangers and cleaning up.

IMG_1020

IMG_0235IMG_0236

//www.anrdoezrs.net/am/7931805/impressions/page/am.js

Intro to the Arduino Board

One of my favorite quotes from Albert Einstein is:

If you can’t explain it simply, you don’t understand it well enough

So I find it stupid that Arduino tutorials would jump straight away into complicated code (called sketches in Arduino), electrical diagrams, and acronyms of complex electrical terms.  Arduinos are an awesome, cheap, and easy way of learning robotics. They’re so simple and should really be explained that way (at least initially), so in this blog post I will set out to do just that.

Overview

I’ll be explaining the Arduino Leonardo, built through Borderless Electronics, obtained through an Indiegogo campaign for a whole $9, and pictured below:

Image

While it has some advanced things that differentiate the Leonardo from other Arduino micro controllers, the big difference is that by having only a single processor they can emulate a mouse and/or keyboard.  In lay terms, you can make a keyboard/mouse that amputees/spinal injuries control without their hands, or a glove that can control a quadracopter.  Pretty awesome, huh?

Digital Vs. Analog Pins

Analog input pins( A0-A5) are on the bottom left, and the digital pins (0-13) are on the right side.  I’ve highlighted both in the below pic

Image

The difference between the two is actually so simple and is usually overcomplicated with voltage diagrams.  An Analog input is like a dimmer switch where you can control the how much light you want from a light bulb, and a Digital input is just a regular switch where output either on or off with no in between.

AREF pin

Image

The AREF pin, or Analog REFerence pin, is the what sets the maximum power (from the left side of the pic above) and every step from zero to max (scaled in sketches 0-1024).  The power is 3.3 volts or 5 volts but these can be change/converted through the use of different techniques (think resistors).

SDA/SCL pins

Image

These pins are used for communicating with other devices. For example, connecting to a lego mindstorm (example build). The SDA pin sends and receives the data between the two devices, and the SCL makes sure that data is being sent and received at the same speed.

VIN

Image

The Arduino has pins for 3.3 volts and 5 volts, but if you want to build something with more power you can use external power put into the VIN pin.  If I was going to build and RC car or the like I would be using this to up the power to the maximum (and probably blow something up)

IOREF and RST

IOREF tells whether the power supplied is 3.3  or the 5 volts, and RST is used to reset the board.

GND pin

Image

GND is for the ground and is needed always used with the power.  It’s to complete the circuit. A battery has two poles, positive and negative. Each side of a light bulb needs to be connected to each of the poles on the battery to complete the circuit and light the bulb.

Now we know what everything does it’s time to make something cool.

Building a TOR wireless router with a Raspberry Pi

Over the summer I stayed with a really close friend’s family in Dallas, and instead of buying the Mother flowers I decided to build her a wireless TOR router because she’s a bit of a conspiracy theorist (her family says that, not me), she uses a Ipad which doesn’t support TOR, and I really wanted to do something that was personal that had meaning and thought behind it.  This router will allow her to browse the net anonymously (without big brother watching), I also fully encrypted the hard drive (in case they come after her), added libre office (open source microsoft office), and even changed the wallpaper to her daughter’s debutante photo (I’ll be hearing about this if she still reads my blog.)  I hope that she actually uses it because it adds legitimacy to TOR because it’s for everyone (she is the sweetest lady, BTW) not just the intelligence community, criminals, and drug dealers.

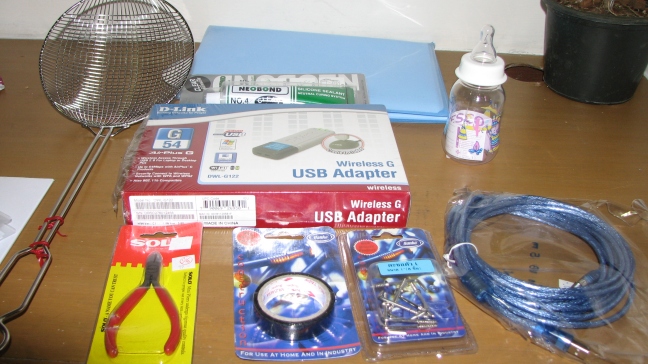
It took me a while to gather the parts to put it together, as I went through a couple wifi adapters before I found one with the right chip set.  Once you have the right parts, installation and setup are easy using this tutorial that I used.  They used nano in the tutorials, but you can use any editor that you feel comfortable with.  I used the following parts:

Setting the Pi as an access point

I used this tutorial.  From the terminal run the following (I ssh’d into the pi from my mac) to install the software:

sudo apt-get install hostapd isc-dhcp-server

Then you need to edit the file for the DHCP server by running

sudo nano /etc/dhcp/dhcpd.conf

The change a couple lines by adding #, and then remove a # from a line so they look like this:
#option domain-name "example.org";
#option domain-name-servers ns1.example.org, ns2.example.org;
# If this DHCP server is the official DHCP server for the local
# network, the authoritative directive should be uncommented.
authoritative;

Then add this to the bottom:

subnet 192.168.42.0 netmask 255.255.255.0 {
range 192.168.42.10 192.168.42.50;
option broadcast-address 192.168.42.255;
option routers 192.168.42.1;
default-lease-time 600;
max-lease-time 7200;
option domain-name "local";
option domain-name-servers 8.8.8.8, 8.8.4.4;
}

Next, we change the interfaces by running

sudo nano /etc/default/isc-dhcp-server

changing the last line to look like this

INTERFACES="wlan0"

Then we set the wireless to have a static IP by running

sudo nano /etc/network/interfaces

making the file read like (change addresses where applicable, I did)

auto lo

iface lo inet loopback
iface eth0 inet dhcp

allow-hotplug wlan0

iface wlan0 inet static
address 192.168.42.1
netmask 255.255.255.0

#iface wlan0 inet manual
#wpa-roam /etc/wpa_supplicant/wpa_supplicant.conf
#iface default inet dhcp

up iptables-restore < /etc/iptables.ipv4.nat

Then tell the wireless adapter it’s address by running

sudo ifconfig wlan0 192.168.42.1

Configure the Access point by a using

sudo nano /etc/hostapd/hostapd.conf

put the following into the file

interface=wlan0
driver=rtl871xdrv
ssid=Pi_AP
hw_mode=g
channel=6
macaddr_acl=0
auth_algs=1
ignore_broadcast_ssid=0
wpa=2
wpa_passphrase=Raspberry
wpa_key_mgmt=WPA-PSK
wpa_pairwise=TKIP
rsn_pairwise=CCMP

be sure to [especially change the ssid (name of the router) and wpa-passphrase (password) and anything else that’s applicable to changes you made early or preferences.

We now need to add a line to file in the editor

sudo nano /etc/default/hostapd

pasting in the following

DAEMON_CONF="/etc/hostapd/hostapd.conf"

You now need to configure the network address by first changing another file

Run sudo nano /etc/sysctl.conf

adding

net.ipv4.ip_forward=1

then run the following to activate the file

sudo sh -c "echo 1 > /proc/sys/net/ipv4/ip_forward"

Finally, to make the ethernet (eth0) and wireless (wlan0) communicate, you need to run the follow commands

sudo iptables -t nat -A POSTROUTING -o eth0 -j MASQUERADE
sudo iptables -A FORWARD -i eth0 -o wlan0 -m state --state RELATED,ESTABLISHED -j ACCEPT
sudo iptables -A FORWARD -i wlan0 -o eth0 -j ACCEPT

so you don’t have to manually do it everytime you reboot, run

sudo sh -c "iptables-save > /etc/iptables.ipv4.nat"

Now all we need to do to get the access point working is running the hostapd software using the following commands

wget http://www.adafruit.com/downloads/adafruit_hostapd.zip
unzip adafruit_hostapd.zip
sudo mv /usr/sbin/hostapd /usr/sbin/hostapd.ORIG
sudo mv hostapd /usr/sbin
sudo chmod 755 /usr/sbin/hostapd

Your access point should now be working. To have all the software start on reboot run

sudo service hostapd start
sudo service isc-dhcp-server start
sudo update-rc.d hostapd enable
sudo update-rc.d isc-dhcp-server enable

Reboot you Pi by running

sudo reboot

Installing TOR

First install the TOR software using this code

sudo apt-get install tor

edit the config file by running

sudo nano /etc/tor/torrc

and paste in

Log notice file /var/log/tor/notices.log
VirtualAddrNetwork 10.192.0.0/10
AutomapHostsSuffixes .onion,.exit
AutomapHostsOnResolve 1
TransPort 9040
TransListenAddress 192.168.42.1
DNSPort 53
DNSListenAddress 192.168.42.1

Now we change our routing tables by running

sudo iptables -F
sudo iptables -t nat -F

Then we set-up for ssh routing in the future (I don’t want to give up a precious monitor)

sudo iptables -t nat -A PREROUTING -i wlan0 -p tcp --dport 22 -j REDIRECT --to-ports 22

now when you want to ssh into the pi you have to add a -p 22 to the command. Like this

ssh -l pi -p 22 192.168.1.100

Now do the other ports

sudo iptables -t nat -A PREROUTING -i wlan0 -p udp --dport 53 -j REDIRECT --to-ports 53
sudo iptables -t nat -A PREROUTING -i wlan0 -p tcp --syn -j REDIRECT --to-ports 9040

Now run the following to activate

sudo sh -c "iptables-save > /etc/iptables.ipv4.nat"

The following will create log files for debugging

sudo touch /var/log/tor/notices.log
sudo chown debian-tor /var/log/tor/notices.log
sudo chmod 644 /var/log/tor/notices.log

Finally, we start TOR manually running

sudo service tor start

Then make it start on every reboot

sudo update-rc.d tor enable

You’re done! You should now be able to connect to TOR wifi using the ssid and passphrase you used early.

The final product is about half the size of a normal router and looks like this:

photo 2

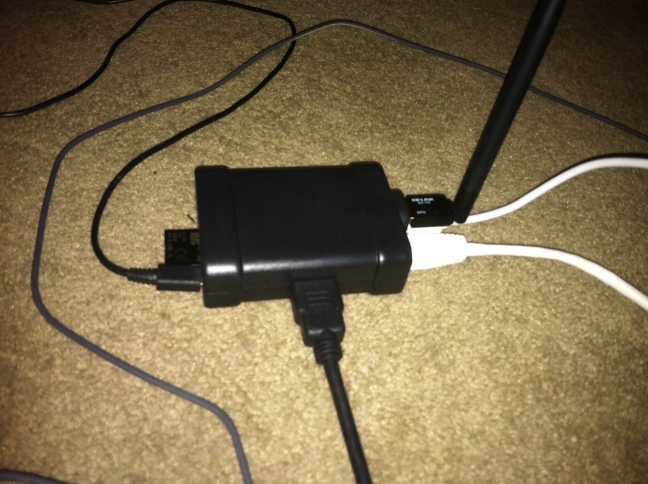
*I was going to post a pic of the desktop (with the debutante photo) but I decided that I value my life… hahhahaha

QED


-update

I did some speed testing on the router last night, and I discovered that you end up with about 25% of the speed that you would through regular wifi.


Scheduling R Tasks with Crontabs to Conserve Memory

One of R’s biggest pitfalls is that eats up memory without letting it go.  This can be a huge problem if you are running really big jobs, have a lot of tasks  to run, or there are multiple users on your local computer or r server.  When I run huge jobs on my mac, I can pretty much forget doing anything else like watching a movie or ram intensive gaming.  For my work, Kwelia, I run a few servers with a couple dedicated solely to R jobs with multiple users, and I really don’t want to up the size of the server just for the few times that memory is exhausted by multiple large jobs or all users on at the same time.  To solve this problem, I borrowed a tool, crontab, from the linux (we use an ubuntu server but works on my mac as well) folks to schedule my Rscripts to run at off hours (between 2am-8am), and the result is that I can almost cut the size of the server in half.

Installing Crontabs is easy (I used this tutorial and this video) in a linux environment but should be similar for mac and windows. From the command line enter the following to install:

sudo apt-get install gnome-schedule

Then to create a new task for any user on the system enter if you are the root user or admin:

sudo crontab -e

or as a specific user:

crontab -u yourusername -e

You must then choose your preferred text editor. I chose nano, but the vim works just as well. This will create a file that looks like this:
Screen Shot 2013-09-03 at 5.01.19 PM

The cron job is laid out in this format:minute (0-59), hour (0-23, 0 = midnight), day (1-31), month (1-12), weekday (0-6, 0 = Sunday), command. To run an rscript in the command just put the “Rscript” and then the file path name. An example:

0 0 * * * Rscript Dropbox/rstudio/dbcode/loop/loop.R

This runs the loop.R file at midnight (zero minute of the zero hour) every day of every week of every month because the stars mean all.  I have run endless repeat loops before in previous posts, but R consumes the memory and never free it.  However, running  cron jobs is like opening and closing R every time so the memory is freed (probably not totally) after the job is done.

As an example, I ran the same job in a repeat every twelve hours on the left side of the black vertical line, and on the right is the same job being called at 8pm and 8am.  Here’s the memory usage as seen through munin:

Screen Shot 2013-09-03 at 5.10.41 PM Screen Shot 2013-09-03 at 5.11.09 PM

I don’t have to worry nearly as much about my server overloading now, and I could actually downsize the server.

QED

Heatmapping Washington, DC Rental Price Changes using OpenStreetMaps

Percentage change of median price per square foot from July 2012 to July 2013:

stamentonerPPSQFT

Percentage change of median price from July 2012 to July 2013:

wazepricechange

Last November I made a  choropleth of median rental prices in the San Francisco Bay Area using data from my company, Kwelia.  I have wanted to figure out how to plot a similar heat map over an actual map tile, so I once again took some Kwelia data to plot both percentage change of median price and percentage change of price per sqft from July 2012 to this past month (yep, we have realtime data.)

How it’s made:

While the google maps API through R is very good, I decided to use the OpenStreetMap package because I am a complete supporter of open source projects (which is why I love R).

First, you have to download the shape files, in this case I used census tracts from the Us Census tigerlines.   Then you need to read to read it into R using the maptools package like this and merge your data to the shape file:

library("maptools")
zip=readShapeSpatial( "tl_2010_11001_tract10.shp" )

##merge data with shape file
 zip$geo_id=paste("1400000US", zip$GEOID10, sep="")
 zip$ppsqftchange <- dc$changeppsqft[match(zip$geo_id,dc$geo_id , nomatch = NA )]
 zip$pricechange <- dc$changeprice[match(zip$geo_id,dc$geo_id , nomatch = NA )]

Then you pull down the map tile from the OpenStreetMaps. I used the max and mins from the actual shape file to get the four corners of the tile to pull down the two above maps (“waze” and “stamen-toner”)

map = openproj(openmap(c(lat= max(as.numeric(as.character(zip$INTPTLAT10))),   lon= min(as.numeric(as.character(zip$INTPTLON10)))),
 c(lat= min(as.numeric(as.character(zip$INTPTLAT10))),   lon= max(as.numeric(as.character(zip$INTPTLON10)))),type="stamen-toner"))

Finally, plotting the project. The one thing different from plotting the choropleths from the Bay area is adjusting the transparency of the colors. To adjust the transparency you need to add two extra numbers (00 is fully transparent and 99 is solid) to the end of the colors as you will see in the  annotations.

##grab nine colors
 colors=brewer.pal(9, "YlOrRd")
 ##make nine breaks in the value
 brks=classIntervals(zip1$pricechange, n=9, style="quantile")$brks
 ##apply the breaks to the colors
 cols <- colors[findInterval(zip1$pricechange, brks, all.inside=TRUE)]
 ##changing the color to an alpha (transparency) of 60%
 cols <- paste0( cols, "60")
 is.na(cols) <- grepl("NA", cols)
 ##changing the color to an alpha (transparency) of 60%
 colors <- paste0( colors, "60")

 ##plot the open street map
 plot(map)
 ##add the shape file with the percentage changes to the osm 
 plot( zip , col = cols , axes=F , add=TRUE)
 ##adding the ledgend with breaks at 75%(cex) and without border(bty)
 legend('right', legend= leglabs( round(brks , 1 ) ) , fill = colors , bty="n", cex=.75)

Getting started with twitteR in R

I have asked by a few people lately to help walk them through using twitter API in R, and I’ve always just directed them to the blog post I wrote last year during the US presidential debates not knowing that Twitter had changed a few things. Having my interest peaked through a potential project at work I tried using some of my old code only to confronted with errors.

First of all, you now need to have a consumer key and secret from twitter themselves. After some research, I found it really easy to get one by going to twitter and creating a new applications.  Don’t be discouraged, anyone can get one.  Here is what the page looks like:

Screen Shot 2013-06-13 at 4.12.47 PM

Enter your name, brief description, and a website (you can use your blog or a place holder), and once you agree it will give you a screen like this where you get your consumer key and secret:key

You now have to authenticate within R by inserting your consumer key and secret into this code:

 getTwitterOAuth(consumer_key, consumer_secret)

It should spit out text and uri to get and input a pin, like:

To enable the connection, please direct your web browser to:
https://api.twitter.com/oauth/authorize?oauth_token=xpf0KGiALpjeChEQvWfP6HqV31VnpZKSs
When complete, record the PIN given to you and provide it here:

You are now ready to use the searchTwitter() function. Since I work in real estate software, Kwelia, I wanted to do sentiment analysis for apartment hunting in manhattan, so I wrote out the following:

searchTwitter('apartment hunting', geocode='40.7361,-73.9901,5mi',  n=5000, retryOnRateLimit=1)

where “apartment hunting” is what I am searching for, the geocode is a lat long with greater circle of five miles of where the tweets are sent from (union square, manhattan), n is the number of tweets i want, and retweet modifies n to the limit of tweets available if n is too high. In this case you, I got back 177 tweets.

QED

Tapping the FourSquare Trending Venues API with R

I came up with the following function to tap into the FourSquare trending venues API:

library("RCurl", "RJSONIO")
 
foursquare<-function(x,y,z){
    w<-paste("https://api.foursquare.com/v2/venues/trending?ll=",x,"&radius=2000&oauth_token=",y,"&v=",z,sep="")
    u<-getURL(w)
    test<-fromJSON(u)
    locationname=""
    lat=""
    long=""
    zip=""
    herenowcount=""
    likes=""
    for(n in 1:length(test$response$venues)) {
        locationname[n] = test$response$venues[[n]]$name
        lat[n] = test$response$venues[[n]]$location$lat
        long[n] = test$response$venues[[n]]$location$lng
        zip[n] = test$response$venues[[n]]$location$postalCode
        herenowcount[n]<-test$response$venues[[n]]$hereNow$count
        likes[n]<-test$response$venues[[n]]$likes$count
        xb<-as.data.frame(cbind(locationname, lat, long, zip, herenowcount, likes))
    }
    xb$pulled=date()
    return(xb)
}

where x=”lat,long”, y=oAuth_token, and z=date. You can find out your oAuth_token by signing into FourSquare and going to https://developer.foursquare.com/docs/venues/trending, click on the “try it out” button, then copy and the code that would be where the deleted box is.Screen Shot 2013-03-04 at 8.44.41 PM

an example:

philly<-foursquare("39.9572,-75.1691","XXXXDSAFAEWRFAEFRAAFDASDFASFD","20130304")

or you can scrape by running in a repeat function.

QED

UPDATE Multiple postgreSQL Table Records in Parellel

Unfortunately the RpostgreSQL package (I’m pretty sure other SQL DBs as well) doesn’t have a provision to UPDATE multiple records (say a whole data.frame) at once or allow placeholders making the UPDATE a one row at a time ordeal, so I built a work around hack to do the job in parellel.  The big problem was that you have to open and close the connections with every iteration or you will exceed max connections since it goes through every row.

First the function for connecting, updating, and closing the DB:

update <- function(i) {
    drv <- dbDriver("PostgreSQL")
    con <- dbConnect(drv, dbname="db_name", host="localhost", port="5432", user="chris", password="password")
    txt <- paste("UPDATE data SET column_one=",data$column_one[i],",column_two=",data$column_two[i]," where id=",data$id[i])
    dbGetQuery(con, txt)
    dbDisconnect(con)
}

Then run the query:

library("foreach")
library("doMC")

registerDoMC()

foreach(i = 1:length(data$column_one), .inorder=FALSE,.packages="RPostgreSQL")%dopar%{
    update(i)
}

QED

DIY Directional Wifi Antenna Booster

While living in Thailand, I rented an apartment where the internet wasn’t provided thinking it would be easy to get on my own.  Boy was I wrong.  Internet was around $150 to start, $100 a month, required a 12 month contract, and you needed a Thai ID (back in 2007), so I went looking for other options. I came across this site and decided to build my own wifi antenna booster out of a chinese spoon, so I could then get wifi from the bigmac shop down the street for free.

The parts were relatively cheap ($50 in all), and most of that expense was in the usb dongle.  My parts list included:

usb dongle

baby bottle (it rains HARD in the tropics)

usb cable (with amplifier if over three feet)

wire cutters (any will do)

Electrical Tape

Silicone Waterproof Sealant

craft plastic mesh(to center in the baby bottle)

Asian wire spoon

IMG_0960

The hardest part of the build is figuring the out the exact the placement of the antena in the spoon.  First you need to find the exact spot of the antenna in the dongle so you can place it right at the focal point of the spoon( I think I actually took off the plastic case to solve this mystery.)  Next you need to find the focal point of the spoon by using Cartesian equation (f=D^2/(16c)) or the square of the diameter divided by 16 times the depth of the spoon. The rest is easy, cut a hole the size of the bottle, put the usb cable through the nipple of the bottle till the distance is right at the focal point and tape the nipple to the wire, and put it all together.  I ended up taping it to my mop handle and leaving it on my balcony railing.

IMG_0962IMG_0961

and the finished product:

IMG_0963IMG_0966

It worked amazingly, I was able to not only get Wifi from the burger spot down the road, but I was also able to get signals from the high rise 1km away.  Here is a pic from in front of my building to illustrate how far it was to the end of the street where the signal was coming from:

Screen Shot 2013-02-01 at 7.17.13 PM